
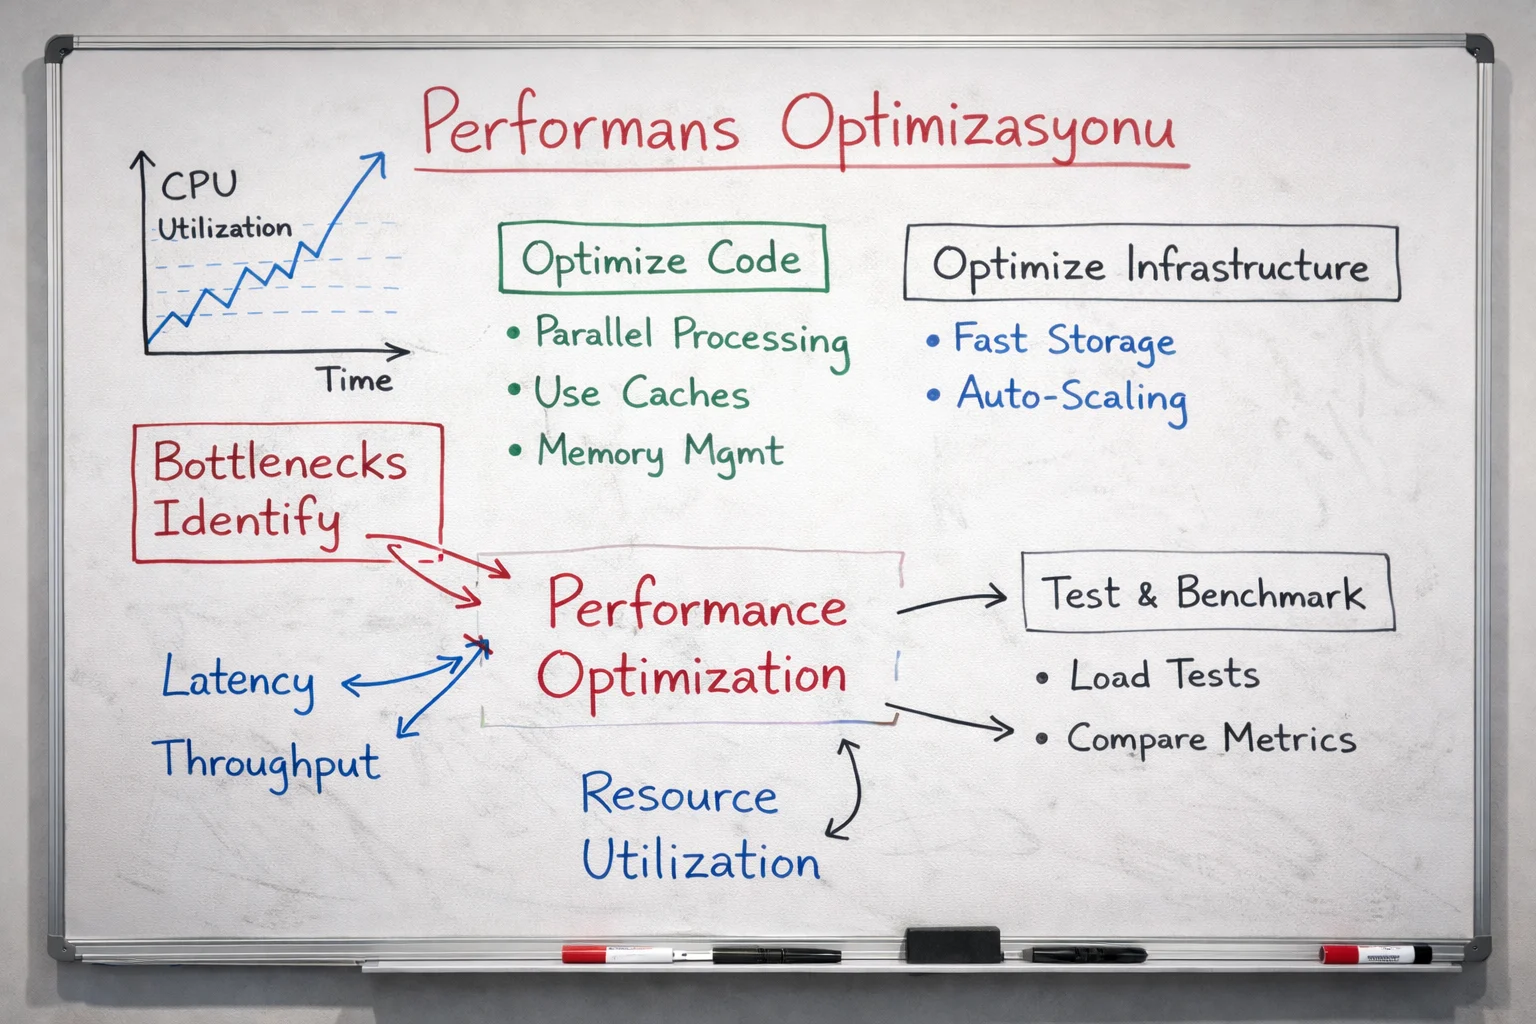
Performance Optimization
We improve system and application efficiency by identifying bottlenecks across CPU, GPU, memory, network, storage and scheduler layers.

Architecture Stages and Infrastructure Design
Deployment and Implementation Flow
Measurement and baseline creation
A baseline is created using benchmark and production workload measurements.
Bottleneck identification
Profiling tools are used to identify bottlenecks in CPU, GPU, memory, MPI, network and storage layers.
Tuning and optimization
System and application performance are improved by tuning scheduler, MPI parameters, NUMA placement, parallel I/O and compiler settings.
Retest and reporting
Benchmarks and scalability tests are rerun after optimization, gains are reported and a long-term tuning policy is defined.
Architectural Approach and System Design
Performance optimization is not only about kernel or BIOS settings; real workload behavior, queue patterns and user policies must be evaluated together.
In-node CPU/GPU usage, NUMA behavior, MPI profile, storage latency and scheduler policy should be evaluated within the same framework.
The goal is not to recommend new hardware first; it is to make the current investment produce more work.
Technical Deliverables and System Benefits
Performance analysis report
Benchmark results, profiling outputs and identified bottlenecks are delivered as a detailed performance report.
Tuning and optimization recommendations
Performance tuning recommendations are prepared for scheduler, MPI, NUMA, network and I/O layers.
Performance improvement report
Before-and-after optimization comparisons and scalability results are documented.